JPG Light Value Analysis with Python, PIL and MatPlotLib
Building a Histogram to analyze the light values of an image
All images used in this post are from the amazing Unsplash.com
Introduction
We'll be making a histogram using matplotlib to display light distribution of pixel count in JPG images. Each pixel has an RGB value(red, green, blue) ranging 0 to 255, with the light value representing the sum of those values. (0,0,0) is black - zero light, and (255,255,255) is white - full light. Our x axis range will be 0 to 765.
For example - The light distribution of the this image ...
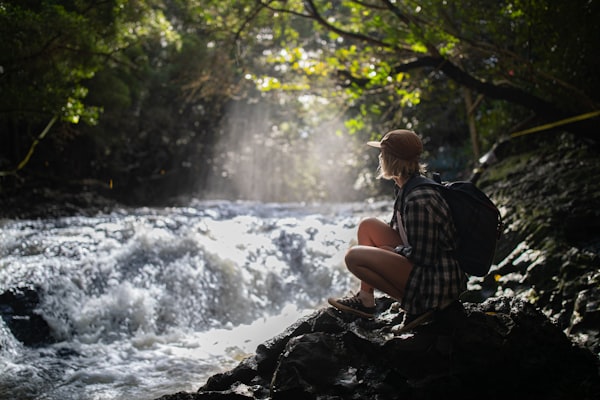
is this -

We can see a large distribution of dark pixels than light ones.
Why are we doing this? Because we can! While I don't have a ton of specific use cases for this, being able to use data to answer questions is important. Our initial question is "What is the light distribution of this image?"
What we'll be doing?
All of the following steps are in Python.
- Use
PILto load an image into memory. - Shrink the image down to a pixel size we can more easily view.
- Use
numpyto convert our image into an array. Flatten the 3d array into a 2d array of the RGB values. - Convert the pixel array into an array of the pixel light values - the sun of the rgb values.
- Use
matplotlibto generate the histogram.
Let's get started!
Use PIL to load an image into memory.
PIL is an absolutely magical package for image processing. I created the getImageFromUrl(url) method that takes in a url, uses python's requests package to make the https request, and then load the image. We need to pass the response content into BytesIO to read the requests content into a format that PIL can consume and convert into an Image object.
By the end of this code, we have an image from the internet in memory as a PIL.Image object.
python
Shrink the image down to a pixel size we can more easily view.
I created a helper method to resize the image file so that it's largest side is a pixel count we pass in. This is to keep pixel count low enough to analyze quickly and in a controlled way. By the end of this block, we have a resized image with 150 pixels as the largest side, and the aspect ratio remaining the same.
python
Use numpy to convert our image into an array. Flatten the 3d array into a 2d array of the RGB values.
the np.array method converts a PIL.Image object to a 3d np array - height by width by pixels (r,g,b). numpy arrays have the property shape, which in the case below returns the width, height, and 3, which is the length of the pixel. I create flattenedShape which will be used to convert the 3d array into a 2d array by multiplying the length by width, which is then passed into reshape(), a method that lives on the np array.
reshape() only works if the number of values remains the same, so had I not multiplied width by height, reshape() would have failed.
python
Convert the pixel array into an array of the pixel light values - the sun of the rgb values.
Boy do I love list comprehensions. Below takes the 2d array and converts it to a 1 dimensional array of pixel light values, by summing the 3 values of the pixel. At this point, we have our data ready to graph!
lightValues = [sum(pixel) for pixel in reshapedImage]Use matplotlib to generate the histogram.
And now, we graph!
python
Full Code
python
Example Outputs
input
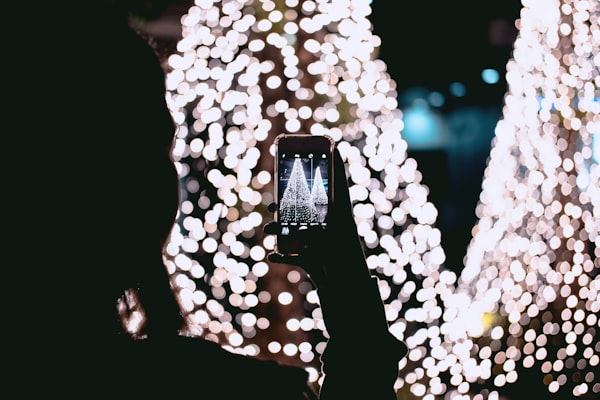
output
![Dark Image light distribution]https://ihkgojiseqpwinwdowvm.supabase.co/storage/v1/object/public/natespilmanblog/making-a-histogram-image-light-with-matplotlib/3lightdistroimages_darkimage.png "Dark Image light distribution")
input
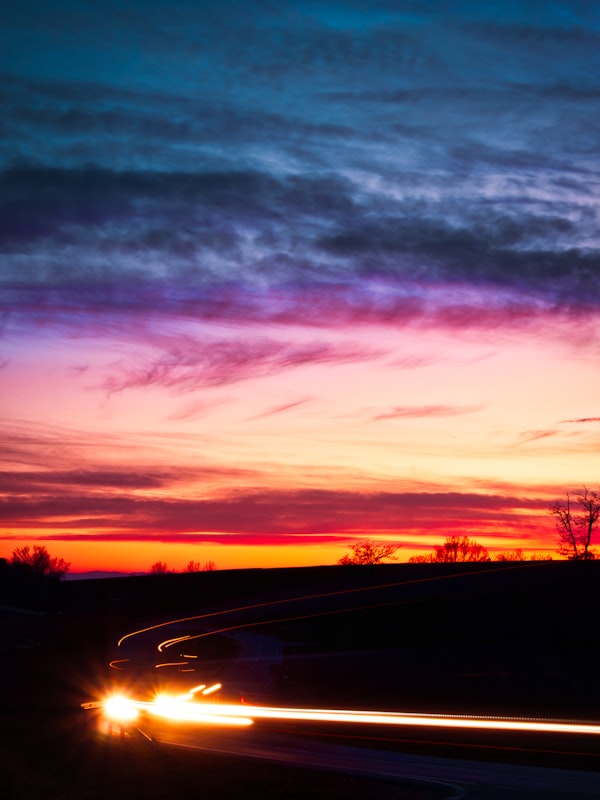
output
![Dark Image neutral distribution]https://ihkgojiseqpwinwdowvm.supabase.co/storage/v1/object/public/natespilmanblog/making-a-histogram-image-light-with-matplotlib/3lightdistroimages_neutralimage.png "Dark Image neutral distribution")
input
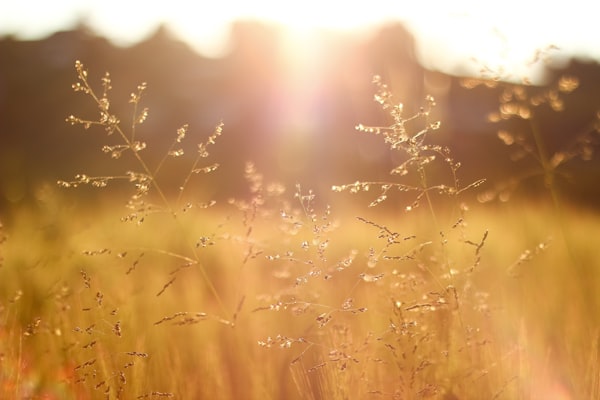
output
![Dark Image light distribution]https://ihkgojiseqpwinwdowvm.supabase.co/storage/v1/object/public/natespilmanblog/making-a-histogram-image-light-with-matplotlib/3lightdistroimages_lightimage.png "Dark Image light distribution")